The Revenue River
ARR Waterfall 101 – What It Is and Why It Matters
The ARR Waterfall Chart is a powerful way to visualize revenue over a defined time period. It captures expansions, contractions, upgrades, and churn. Rather than giving you a simple ending number, it reveals how ARR shifts due to factors like new sales, customer churn, downgrades, cross sell activity, and upsells. These insights support smarter decisions for any business model built on subscription revenue and long term user experience.
For those considering hiring a fractional CCO or other part-time executive roles, the ARR Waterfall provides a straightforward and actionable way to track recurring revenue and guide customer focused strategy. At Reditus, we consider the ARR Waterfall a key tool in customer experience strategy and revenue recognition efforts. It gives fractional leaders a clean and easy way to understand revenue generated across existing customers without requiring a full time team.
Download the file HERE
Breaking Down the Waterfall – Components Explained
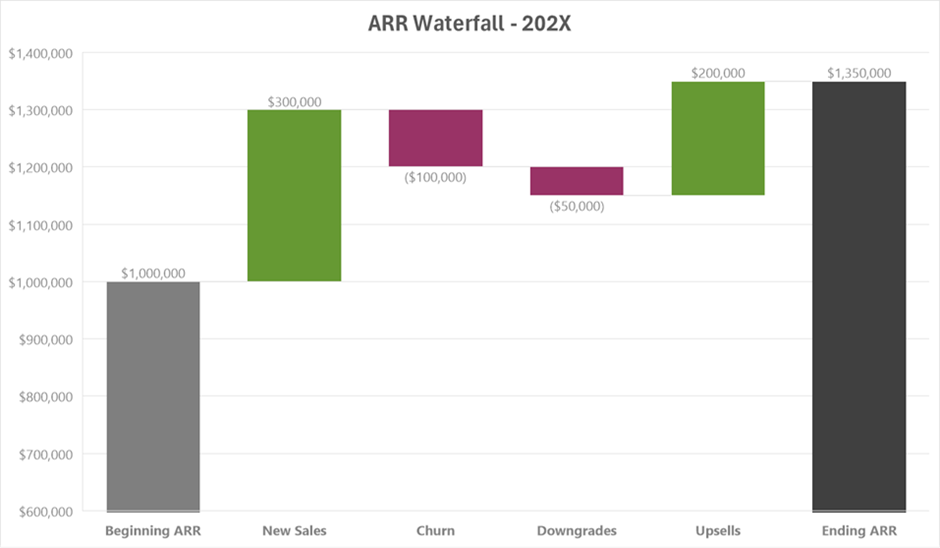
Let’s walk through the components of an ARR Waterfall Chart using the example above:
- Beginning ARR: This is your starting point. It represents the baseline
- Annual Recurring Revenue (ARR) at the beginning of the chosen time period. Knowing this number gives you a foundation for tracking revenue growth and evaluating long term sustainability for any early stage SaaS operation.
- New Sales: New sales represent revenue from acquiring new customers. This is a key indicator of how well your growth strategies resonate with your target market. Strong new sales support high growth and reduce the pressure on customer success teams to compensate for weak customer acquisition.
- Churn: Churn represents lost ARR due to customers leaving entirely. This is one of the most important metrics in any SaaS company because a rising churn rate can signal problems in product market fit, customer experience, or onboarding. We always track churn separately from downgrades because churn reflects a complete exit from the customer journey.
- Downgrades: Downgrades represent reduced revenue from existing customers who remain active but lower their spend. This often signals short term budget pressure rather than dissatisfaction. Tracking downgrades separately from churn highlights customers who may still expand later and gives customer success teams a clear opportunity to intervene and retain long term value.
- Upsells: Upsells represent additional revenue from existing customers upgrading to higher value plans. Strong upsell and cross sell performance usually indicates customer satisfaction, a healthy user experience, and a product that continues to deliver more value over time.
Ending ARR: After accounting for new sales, churn, downgrades, and upsells, you reach your Ending ARR. This number reflects your revenue strength moving into the next period and tells you how well your customer success and customer acquisition systems are working together.
Why the ARR Waterfall Matters for SaaS Business Models
The ARR Waterfall Chart is more than a financial report. It is a strategic tool that connects revenue growth with customer behavior and helps SaaS companies identify opportunities to improve customer retention and reduce customer acquisition costs. Here is why it matters:
- Aligning Revenue Goals with Customer Service: Understanding how ARR changes over time helps companies align customer service and customer success with revenue goals. It provides clear insight into customer churn, expansion patterns, and areas where the user experience may need improvement.
- Supporting Fractional CCO Decisions: Fractional executives, like a Fractional Chief Customer Officer, rely on simple, reliable data to guide decisions. The ARR Waterfall reveals how existing customers behave and how revenue generated across the customer base shifts over time. This helps part time leaders make effective decisions about retention, expansion, and cross functional alignment.
- Adaptable for any SaaS Company: Whether you are early stage or scaling fast, the ARR Waterfall creates transparency. It works for any subscription model and supports high growth companies that need fast, valuable insights into revenue performance.
Leveraging the ARR Waterfall for Long-Term Customer Success
Tracking ARR through a waterfall chart goes beyond watching revenue fluctuate. It helps SaaS companies build more predictable systems for growth and customer retention.
- Sustaining Growth: The ARR Waterfall highlights patterns in expansion, contraction, and churn. This visibility helps SaaS companies focus on the right improvements and supports stronger revenue streams over time.
- Spotlight on Customer Journeys: The chart reveals how customers move through different stages of their lifecycle, from onboarding to upgrades or reductions. Patterns like downgrades or stalled expansions can signal friction in the user experience.
- Financial Planning and Revenue Recognition: The ARR Waterfall supports accurate forecasting and financial planning. Investors, finance teams, and leaders depend on reliable ARR tracking to make informed decisions.
Conclusion: ARR Waterfall – A SaaS Essential
The ARR Waterfall Chart is a vital tool for SaaS growth. It tracks revenue changes and highlights the behavior of existing customers in a way few other tools can match. At Reditus, we believe this chart is essential for guiding both customer retention and customer acquisition strategies.
By tracking churn and downgrades separately, companies can understand customer intentions more clearly and give customer success teams the ability to intervene effectively. Whether you are considering a fractional CCO or simply trying to improve your SaaS business model, the ARR Waterfall provides a clear and actionable view of how revenue truly behaves.
FAQ: ARR Waterfall and SaaS Growth
What is an ARR Waterfall Chart?
An ARR Waterfall Chart is a simple visual that shows how Annual Recurring Revenue changes over a time period. It highlights new sales, churn, downgrades, upsells, and ending ARR. SaaS companies use it to understand revenue streams, customer churn, and customer retention.
How does the ARR Waterfall help SaaS growth?
It shows where your revenue actually comes from. This helps leaders understand whether growth is driven by acquiring new customers, upselling existing customers, or reducing churn. These insights support a healthier business model and better long term planning.
Why track churn rate separately from downgrades?
Churn reflects customers who have left entirely. Downgrades reflect customers who remain but spend less. These two groups behave very differently, so separating them helps customer success teams protect revenue and improve user experience.
Can the ARR Waterfall help with understanding product market fit?
Yes. In early stage SaaS, patterns in churn, downgrades, and slow expansions often reveal product market fit issues. If customers do not expand or refer others, your offering may not be strong enough yet.
How does the ARR Waterfall support customer success?
It identifies which customers are expanding, which are contracting, and which are at risk. This allows customer success teams to focus on retention, improve customer journeys, and drive upsell or cross sell opportunities.
Does the ARR Waterfall help reduce customer acquisition costs?
Indirectly yes. When existing customers expand more reliably, you do not have to rely as heavily on acquiring new customers to drive SaaS growth. Strong retention and expansion reduce pressure on CAC.
Is the ARR Waterfall useful for early stage SaaS companies?
Absolutely. Early stage SaaS teams gain valuable insights by tracking even small changes in ARR. The chart reveals weak spots in onboarding, adoption, user experience, or pricing.
How often should a SaaS company review its ARR Waterfall?
Most companies review it monthly or quarterly. High growth teams often check it monthly because rapid shifts in customer behavior can impact revenue generated very quickly.
